Portfolio operations
Across 20 properties the failure mode is not backlog. It is drift.
At one property you can see the problem. Across a portfolio each site develops its own version of the process, and the average hides every one of them.
40+ of the 100+ deployed properties run at 100% work order closure.
What holds a standard together
Four things, none of which is a training session.
Consistency across 100+ properties is a systems problem.
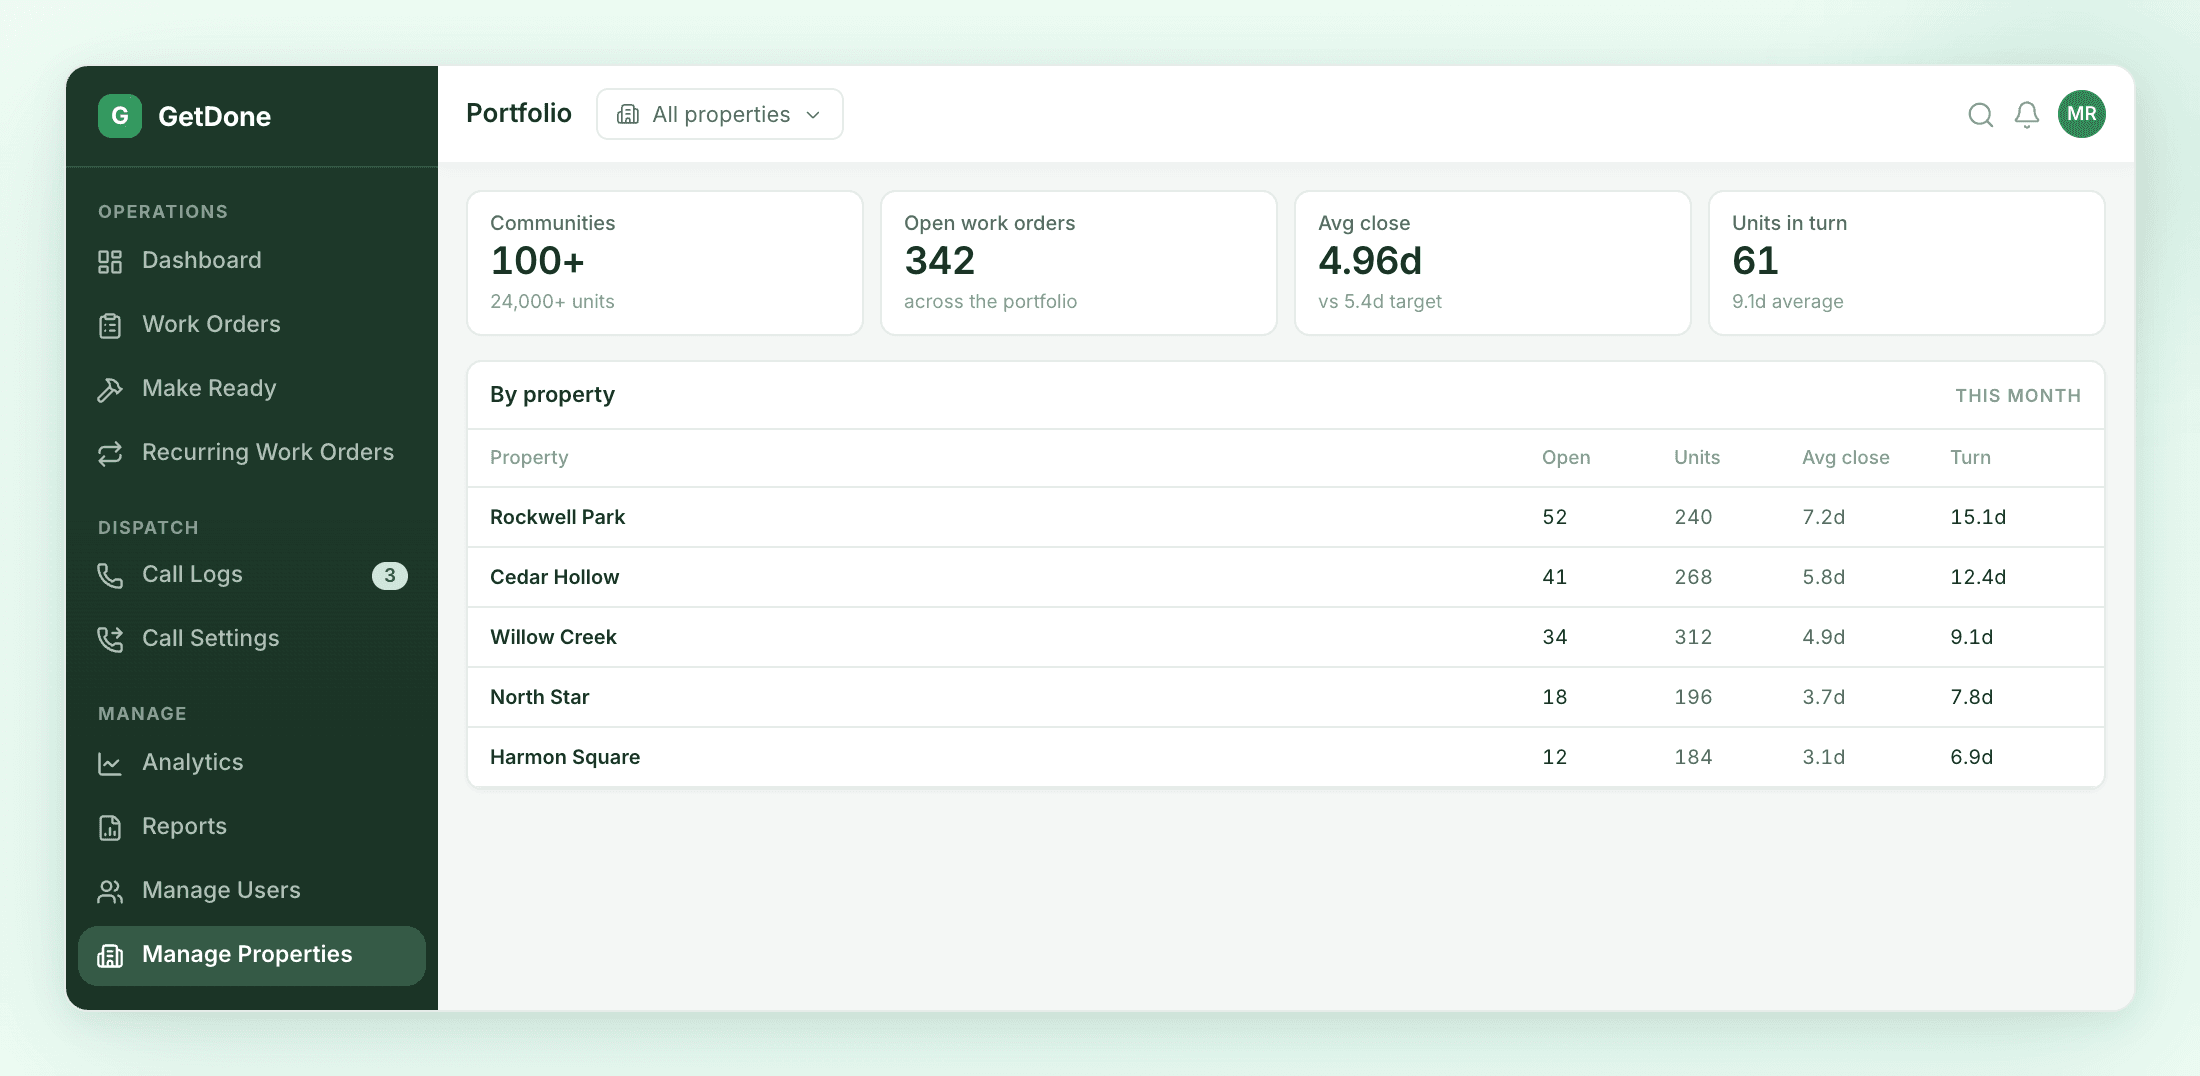
One view, every property
Analytics tabs for properties, technicians, first-time fix, turns and charges, and data hygiene. A regional stops calling five supervisors to assemble a picture.
Standard workflows, local settings
Feature flags target by property, so a lease-up asset and a 1966 Class C can run the same high-risk workflows with different requirement sets.
Preventative schedules by vintage
Portfolio-wide PM templates targeted by year built, vintage, and market, fanned out nightly. Filter swaps stop depending on who remembered.
Data hygiene as a metric
Its own analytics tab. A portfolio report is only as good as the worst-maintained property feeding it, and this tells you which one that is.
Where drift shows up
A whiteboard only one person can read.
Every portfolio has at least one property where the process lives in the maintenance supervisor's head. It works until that person takes a week off, and then the whole site stalls.
No visibility into work order status across properties
Turn times that cannot be compared between sites
High-risk tasks handled differently at each property
No paper trail when an insurer asks about one incident
Tech efficiency estimated rather than measured
ResProp, one year
- More work orders closed within 24h
- 31,628
- Faster work order closure
- 10%
- Potential claims exposure mitigated
- $810K
- Properties at 100% closure
- 40+
600+ employees. 24,000+ units. Third-party manager, so every property answers to a different owner with different reporting.
FAQ
Portfolio questions
What is different about multi-site versus one property?
How do you keep an average from hiding a bad property?
Can regional managers see only their own properties?
How do property attributes stay current across 100+ properties?
Does adding a property mean a new implementation?
Ask for your worst property, not your average.
Bring the site you would least want an owner to audit. That is the one worth looking at together.